Skip to content

5 financial reports independents should revisit annually

New year, new financial reports. Run these reports to be sure your business is in tip-top shape for 2023.

Independent updates financial reports in the new year.

New independent business owners, small business professionals, and consultants often overlook key pieces of financial paperwork. As tedious as it may seem, financial reporting is necessary. Reports serve as your yardstick to track your business’ progress. This is true for small brick-and-mortar shops, selling online, and service providers. With financial reporting, all such businesses can make strategic and tactical choices to drive growth. 


The abundance of financial reporting options may be daunting for newer business owners. Many avoid accounting because they fear doing it wrong or wasting too much of their time—time that’s already limited. Fortunately, clarity around what you need and why can help you prioritize reporting and financial management for your independent business.

Jump to:

What is financial reporting?

Financial reporting is an accounting practice that requires periodic disclosure of a company’s financial information and performance by preparing some statements. If you’re an independent business owner, this is usually done in a quarterly fashion. If you wish to accurately know how much money your company has, where it’s coming from, and where it needs to go, you need a financial report.

Your financial reporting journey starts with proper bookkeeping for your business, where you record day-to-day transactions. You need to record things like day-to-day income, expense, and other tax-related information and pull such information when revisiting financial reports.

Here are five key financial reports you need to revisit yearly to stay compliant, grow your business, and make data-backed growth decisions.

Pro Tip:  It’s also smart to review these reports quarterly. Speak with a financial advisor to ensure your calculations are accurate if you can!” 

1. AR days vs. AP days report

Accounts receivable days are the average number of days it takes to receive paid-for goods and services a firm provides. In contrast, the typical number of days it takes to pay suppliers and other businesses is known as accounts payable days. The difference between these two numbers for the given timeframe represents available funds. When you create AR and AP days, you will have a better gauge on expected income and expenses.

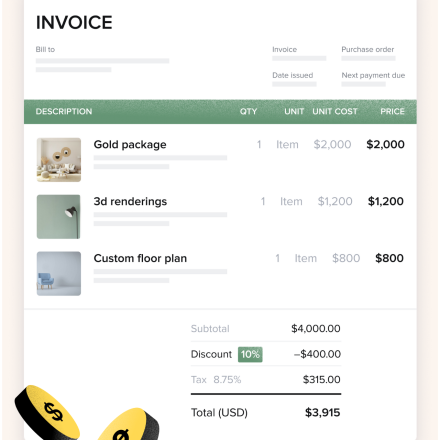
This ratio may vary greatly from industry to industry, making it essential for your business to compare results to past years to analyze the current business position. You can compile this report periodically to keep tabs on the ratio’s evolution over time. Make contact with clients to receive goods and make payments with HoneyBook’s easy-to-use payment processing software. Send secure invoices and receive payment in the same email—it gets even easier with HoneyBook’s invoice templates.

When the ratio of AR Days to AP Days is low, a business can adjust how customers pay and work with contractors or vendors for more flexible payment options and/or change the timing of invoices.

2. The balance sheet

A balance sheet offers a quick overview of your business’s financial standing. Independents and small businesses need to create a balance sheet to list all their liabilities, assets, and equities.

What are liabilities, assets, and equities?

Here’s a breakdown of what all these terms mean!

Equities: Equities are your total assets minus your liabilities.

  • Liabilities: Liabilities are everything that’s owed by your business. For example, money owed to a contractor is a liability, and so is money owed to vendors. Loans, credit lines, and salaries are liabilities.
  • Liabilities = Assets – Owner’s equity

It can be current, short-term, or long-term. 

  • Short-term liability includes stock and supplies, employee payroll, bills, invoices, etc. 
  • Long-term liability includes bank loans, deferred taxes, mortgages, etc.

Assets: Assets are everything a business owns. There are current assets (assets that can be quickly converted to cash) and fixed assets (items like a computer or a car that have value but take time to convert to cash).

  • Assets = Liabilities + Owner’s Equity
  • Current assets include liquid funds and other assets that can turn into cash in a current financial year. 
  • Fixed assets like machinery, furniture, building, land, etc.

The assets and liabilities should match and be at zero. Keep in mind that this is just a moment in time in your business; it’s like a snapshot of your situation.

3. Income statement (aka profit and loss or P&L)

Widely known as the Profit and Loss statement, independents usually prepare this income statement to discover whether the business is operating at a profit or taking losses. You cannot rely solely on your memory alone or take an occasional glance at your bank account to determine a business’s profitability. Not to mention when tax season arrives, your profit and loss can determine what you pay, or owe, which is a liability.

Create this report to forecast future sales and expenses. Choose a time frame that may range from a few months to a whole calendar year. This will help you determine the net profit figure. You can refer to AR and AP days reports to arrive at expected expenses and gains.

How to calculate profit and loss

Use this formula to arrive at your net profit:

Net Profit = Gross Profit – Total Operating Expenses 

Gross profit is a gain from sales after deducting the Cost Of Goods Sold (COGS). 

Gross Profit = Sales – COGS 

  • Revenue: Money earned from selling goods or services
  • Cost of Goods Sold (COGS): Usually, your COGS includes raw materials, payroll taxes, and overhead costs like equipment repairs, payments made to material suppliers, transportation, bills, etc.
  • Gross Profit = Revenue – COGS
  • Operating Expenses: The cost associated with running your business barring the COGS.
  • Net Profit = Gross Profit – Operating Expenses

Your income statement will have two parts: revenue and expenses.

Revenue includes

  • Operating revenue from services and goods you sell.
  • Non-operating revenue earned through subleasing, interest on loans, rent, etc.
  • Gains on long-term asset sales. This includes revenue made by selling a shop, machine, and other assets.

Expenses include

  • Operating expenses like payroll, rent, operational utilities, etc., and marketing costs
  • Non-operating expenses like interest payments on loans, debt, etc.
  • Losses from asset sales and lawsuit damages.

The growing dependence on independents suggests that it’s more important than ever to create profit and loss statements for self-employed revenue. With 73% of tech companies integrating teams of contractors and employees, even small-scale sole proprietors and independents must create this report to keep track of business operations.

4. Cash flow statements

Your cash flow report shows the inflow and outflow of cash. This important report shows whether your business has enough cash to pay its expenses (including paying you, the independent business owner) and purchase assets. This report includes an income statement showing the money your business generated and an expense statement of money you spent to keep your business operating smoothly.

The bottom of the cash flow statement will show you a net increase or decrease in cash. 

Your cash flow statement will have three main parts. Each part reviews the cash flow from one of three headers:

  • Investments
  • Operations
  • Finances

Finances

This cash flow statement contains records of money brought in and spent on financing operations. 

Investments

Next, your cash flow statement will contain the inflow and outflow of funds from investing activities. An investment is really anything that will help your business generate income. The cash flow statement will categorize equipment purchases as an outflow from investment activities as it is a cash expenditure.

Operations

Under operations, your cash flow statement shows cash inflow and outflow based on net earnings and losses. Include the operations header in a cash flow statement to indicate how the net income reported on the income statement compares to the cash received through sales or spent on operational activities.

5. Budget vs. actual report

Compare the actual expenditure against the budget and gauge income from sales estimates with the Budget versus the Actual report.

This report will help identify the areas of excess spending. The results will help you adjust future budgets by reducing costs or enhancing asset allocations. In contrast, knowing where expenses fell short of projections might pave the way for extra allocation — hiring more staff, purchasing new machines, renting a bigger place, etc. 

Budget preparation should include creating a report detailing how actual results compare to those projected. Then, leverage the unused budget to pay for future revenue-generating activities and try cutting expenses if you have overspent.

You may overrun the budget but creating this sort of report helps dig deep into the root causes of business discrepancies. When done correctly, this quarterly or yearly iterative approach increases budget precision and enables quick reorientation.

Start the year off right

As an independent business owner, you can begin your journey to financial reports with bookkeeping. It will help you understand how much your business makes and how much you have to spend to keep it functional. Preparing year-end reports gives you a clear picture and puts you in a position to inquire about yourself, albeit your business decisions and the working standards of your staff. Streamline your business by creating and revisiting the above-mentioned financial reports.

Once you have up-to-date and correct financial reports, you will be in a better position to gauge the growth opportunities and ways to tackle business bottlenecks. A comprehensive familiarity with and upkeep of these records also prepares you for crucial discussions with possible lenders and investors.

Blog tags:

Share to:

Related posts